What is a Candlestick?
Candlestick pattern refers to a kind of price charting technique that is used in technical analysis which makes it easier for a trader/investor to recognize the high, low, open, and closing price of an asset for a particular period of time. Visit MultiBank Group
Candlestick patterns may be useful to chart various types of assets such as stocks, derivatives (futures and options), currencies, cryptos, etc to predict the movement of their rates in the future.
How to Read Candlestick Patterns?
Candlestick patterns are among the common technical traders as compared to line charts or bar charts. This is because candlestick charts will make it relatively easier to deliver more data points to technical analysts than other charting techniques.
Typically, a candlestick includes these data points:
- Open Price
- Close Price
- High Price
- Low Price
- Direction
- Range
Open Price
It refers to the price at which the stock opens in the market at the beginning of a trading session. When the price goes beyond the open price, the candle would become green while if it goes under the open price, the handle color changes to red.
High Price
The upper shadow represents the highest trading price of that trading session.
In the case of a red candle, no higher shadow means open=high. In the case of a green candle, no higher shadow means close=high.
Low Price
The lower shadow stands for the lowest price of a particular trading session.
In the case of a red candle, no lower shadow means close=low. In the case of a green candle, no lower shadow means open=low.
Close Price
Closing price stands for the last price at which a stock trades in a normal trading session. If the closing price is greater than the open price, the candle becomes green hinting at a bullish market. If the opening price turns out to be greater than the closing price, the candle becomes red hinting at a bearish market.
Direction
The price direction becomes clear because of the colour of the candle. In case the market happens to be in favor of the bears,i.e., in case the closing price is under the opening price, the candle would turn red while if it favors the bulls, the candle turns green.
Range
Range refers to the difference in prices between the highest and the lowest rate in the duration where the candle takes shape. In order to calculate the range, deduct the lowest price of the candlestick from the highest (High price-Low price).
Below are certain assumptions that are particularly for candlestick charts which must be taken into account while reading the candlestick pattern.
- Though the technical meaning of the candlestick pattern could outline particular criteria, it is possible for the readings to indicate a bit of variation from the textbook definition on the basis of market conditions.
- It is wise to search for a prior trend. A bullish reversal pattern generally has a prior trend with a bearish pattern and a bearish reversal pattern may have a prior trend with a bullish pattern.
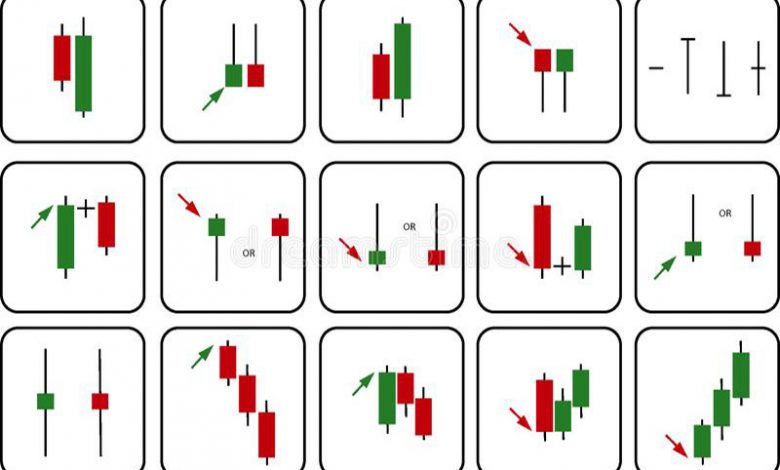
Important Candlestick Patterns
There are several candlestick patterns that technical analysts use. However, the broader categorization of candlesticks have the following three major patterns.
Categories of Candlestick Patterns:
Bullish reversal patterns
Bullish reversal candlestick pattern hints at an ongoing downtrend which is likely to end and may shortly move to an uptrend.
The bullish candlestick pattern could have a single candlestick pattern or multiple candlestick patterns. A bullish reversal pattern should take shape at the end of a downtrend and if that doesn’t happen, it would continue to behave in a similar way as a continuation pattern. It is of utmost importance to confirm the reversal signal that the bullish reversal pattern with indicators reflects like high trading volume.
Bearish reversal patterns
A bearish candlestick chart pattern takes place if there’s an ongoing uptrend that could shortly end and go back to a bearish trend or downtrend. The bearish reversal candlestick could even look like a single candle or multiple candles.
It is necessary to bear in mind that in case the bearish reversal patterns don’t shape up at the end of the downtrend, it would behave the way a continuation pattern does.
Continuation patterns
Continuation patterns indicate that the prices are moving in the same direction as before. The continuation pattern even includes many variations which technical analysts use to establish that the rates continue to trend.
Even though it becomes important to understand that all patterns would not lead to a continuation of the trend. The pattern becomes very reliable if the trend moving into a pattern turns out to be strong and this pattern turns out to be small with respect to the trending waves.
How can Candlestick help you enhance your trading strategy?
As we discussed at the beginning, candlestick patterns mention the four price points – opening, closing, high and low, of a particular trading period which the trader chooses. Hence, the candlestick pattern is often used by traders to establish the price movements which are possible on the basis of past candlestick patterns.
Several present-day algorithms are formed on the basis of the price information shown by this candlestick pattern. Given that trading is generally steered by emotion, the candlestick charts make it easier to unravel the buying pressure and selling pressure, which makes it easier for a trader to make decisions about entering and exiting a market.
The candlesticks turn out to be a wonderful financial instrument for technical analysis which is useful for traders in creating their trade strategies. Now that we know how important technical analysis is in trading, candlesticks enter the picture as a useful tool. Know more brókeres de social trading
As candlesticks are formed due to the up and down price movement, they might appear random. However, at other times, they create different patterns which traders use for technical analysis and choose their market entry and exit points. Hence by showing the opening and closing prices, and market movement, candlestick analysis is useful in predicting price direction which is a major part of devising trade strategies.
Follow – https://bitcointodays.com for More Updates